How to Pull an Attendance Summary Report with Zen Planner

One of the most common questions we get on the Zen Planner Support Team revolves around pulling an attendance summary report. It’s important as a business owner to have quick insight into how popular your classes are and which of your members are coming in the most frequently. This is especially true as we enter into the infamous “summer slump” when it comes to gym attendance. For recommendations on how to combat your attendance dry spells, see our blog on How to Beat the Summer Attendance Slump.
Why It’s Important to Track Attendance
As you know all too well as a fitness business owner, just because someone purchases a membership or even reserves a spot in a class doesn’t mean they will actually walk in the door and show up. The “flake” effect is very real. Between summer plans, old habits creeping back up, and the ebb and flow of personal motivation, members may not be attending as consistently as you may hope. The more insight you have into the numbers behind folks’ attendance history, the more dedicated you can be to draw them back in.
That being said, some of the factors behind why some people don’t attend are completely within your power: staff members and class schedule. Are there specific times a day or specific programs that see fewer reservations than others? Is a particular staff member more popular than others and can therefore drive more attendance? These and other questions can be answered by pulling an attendance summary report from Zen Planner.
Check out the following reports in Zen Planner that will be your best friend when tracking attendance trends.
Pre-Built Attendance Reports
While logged into Studio, click on Dashboard. In the left grey column, you’ll see a section called Saved Reports, which houses a collection of pre-made, hard-coded reports plus any reports you’ve created and saved yourself.
In the Attendance section, you’ll see over 10 reports Zen Planner has pre-loaded into your database. The top three can give you some of the biggest insights into how popular your classes are and how active your members are in coming to the facility:
- Attendance Averages Report
This report will show average attendance for all your class days/times over several different data ranges. In the filtering criteria at the top, you can group by program or staff member and take a look at different date ranges, like for the year, month or quarter, to name a few. Use this report to see how many classes for a particular program or staff member have taken place, how many total attendances are allocated to those classes, which will yield your average attendance overall.
- Attendance History
Want to see all your current students and their true attendance totals? This is the report for you. With a total list of your current members, you can get an easy snapshot at how many true attendances they’ve amounted this month, this quarter, this year and several other data ranges (identical date range to the Attendance Averages Report above).
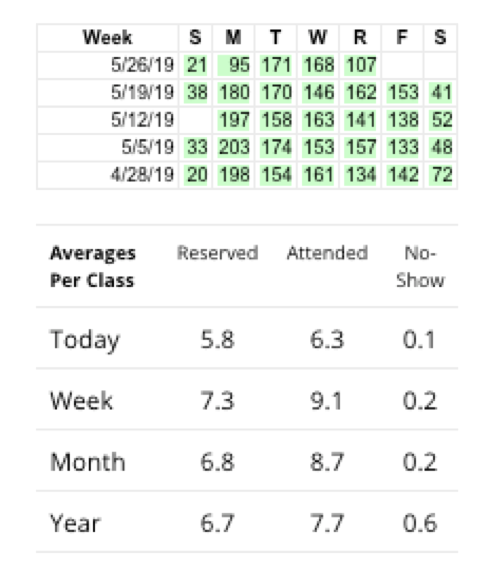
- Attendance Summary Report
What did attendance look like across all your classes on a particular day? Open this report, and you can choose a specific date to find a summary of each class/time that day of how many people reserved, attended, and didn’t show. Furthermore, there are some great charts at the bottom that’ll show total reservations, attendances or no-shows per day over the past five weeks:
Custom Attendance Totals
Sometimes, you may want to look at more customizable pieces of data regarding attendances. To create a custom Attendance report, go to Dashboard > New Report > Attendances. Let’s say you did an attendance challenge from Mother’s Day through Father’s Day to see how many attendances your members with the Annual Unlimited membership could rack up. You’ll set the criteria at the top as follows:
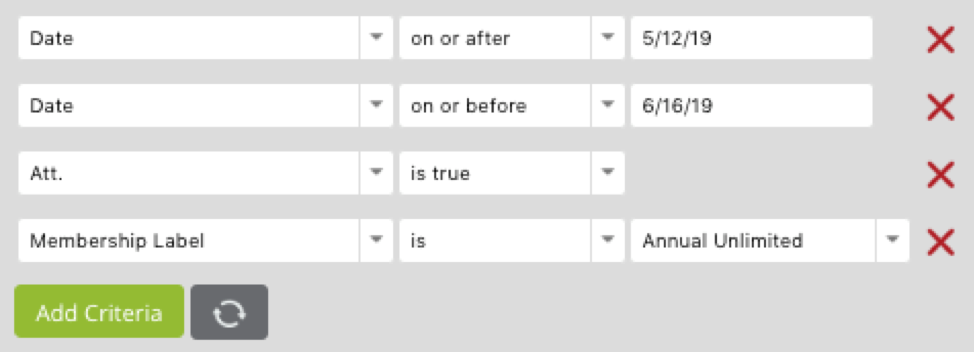
Once you refresh the report, you’ll see all attendance records that meet the criteria above. However, you don’t want to see all the raw data; you just want to see the total per person. Go to Edit Report Settings > Format: change to “Totals” > Group By: choose “Person” > Refresh Report. You’ll then see the summation of all those attendance records alphabetized by person. Maybe it was actually a men vs. women challenge. Go back to Edit Report Settings > Group By: choose “Gender” > Refresh Report. Now you’ll see the summation of all attendances for that membership option between your specified dates grouped by male and female.
With custom attendance reports, there are thousands of criteria and grouping combinations you can look at to gain more insight into attendance trends at your facility. If you ever need help creating a custom attendance report, simply reach out to our amazing support team for assistance.
Phone: 866-541-3570, available Monday through Friday, 7a-7p MST
Email: help@zenplanner.com, available Monday through Friday, 7a-7p MST (plus weekend support)
Attendance reports can yield important insights and warning signs related to member retention.
Download our free retention guide to learn more about detecting these signs.

I’m Coach Kelli, a devoted CrossFit gym owner with 15 years of experience managing my facility, along with owning yoga studios and wellness centers. Beyond the fitness world, I have a passion for cooking, cherish moments with my children and family, and find joy in spending time outside. Having experienced the highs and lows, I’m dedicated to leveraging my expertise to help you grow and succeed on your fitness journey.
About the Author: Kelli Sweeting


I’m Coach Kelli, a devoted CrossFit gym owner with 15 years of experience managing my facility, along with owning yoga studios and wellness centers. Beyond the fitness world, I have a passion for cooking, cherish moments with my children and family, and find joy in spending time outside. Having experienced the highs and lows, I’m dedicated to leveraging my expertise to help you grow and succeed on your fitness journey.


