
Using the Power of Zen Planner Reporting to Improve Your Business Results
Put simply, our membership management software does a lot to help fitness business owners manage and grow their gym, school, studio or box. Our goal on the Customer Advocate team is to ensure our customers are using Zen Planner to its full potential. In today’s post, we’ll dive deep into our rich reporting features, and we’ll share some of our favorite reports that you can start utilizing today.
How to customize your dashboard
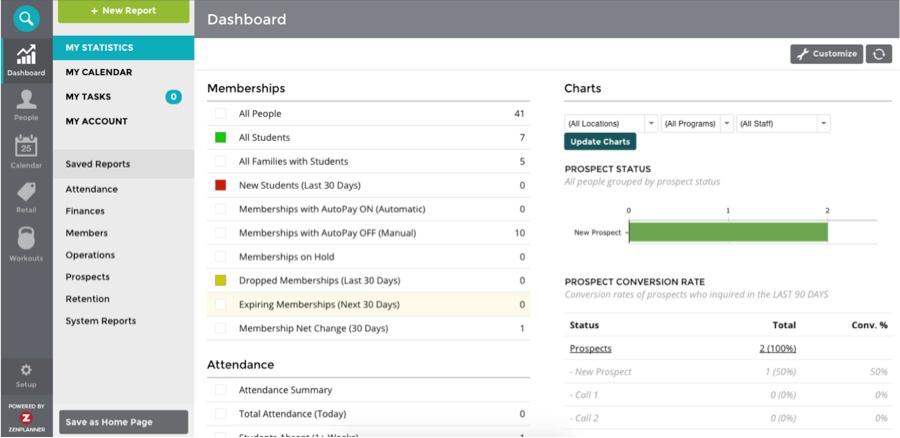 Every piece of data for your fitness business can be found in different reports within your Zen Planner database. The information most pertinent to your day-to-day business operations is displayed on the My Statistics page, which is essentially a snapshot of your business.
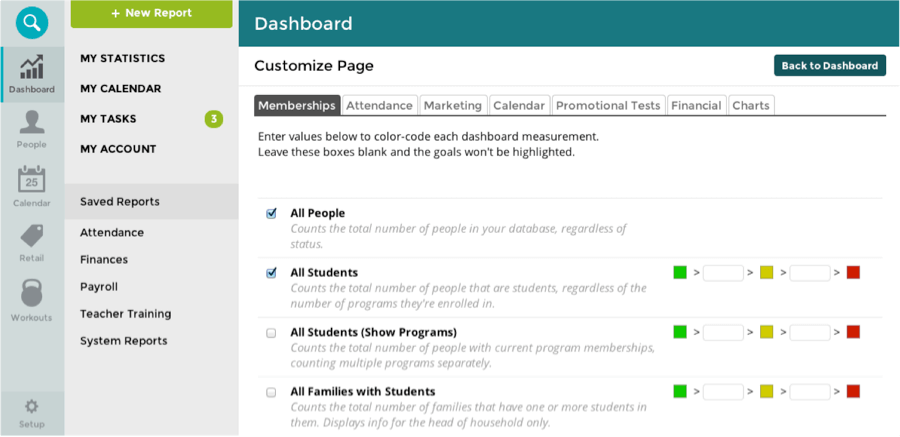
You can customize your Dashboard to reflect the data you want to see regularly. If you want to see past-due bills, but don’t care about attendance, you can edit those selections and only show what you want to see on the fly. You can also include usual visuals under the Charts tab that give you key insight into areas such as attendance and prospect conversion rates.
There are a few reports and key performance indicators we recommend including on your Dashboard:
- Under the Memberships tab: New Students (Last 30 Days), Memberships with Autopay Off (which means you’re going to bill them manually), Membership Net Change, and Expired Memberships (Last 30 Days)
- Under the Financial tab: Failed Payments (which is not the same as past due bills), Past Due Total, Payments (Last 30 Days), Amount Due (Next 30 Days)
Another great thing about these at-a-glance reports is that they empower you to establish goals or health levels for your business. We created these useful color-coded divisions for each of these metrics so you know right off the bat how your business is doing. They look like a stop light; if the report is green, you’re doing well, and if it’s red, that metric needs a little extra love. For example, if you have fewer than 20 students, the report on your Dashboard will have a little red square in front of it, however, if you have more than 30, it’ll show as green, and anything in-between will be yellow. You can set those values to reflect the numbers in your own gym, of course.
Are you running the right reports for your business?
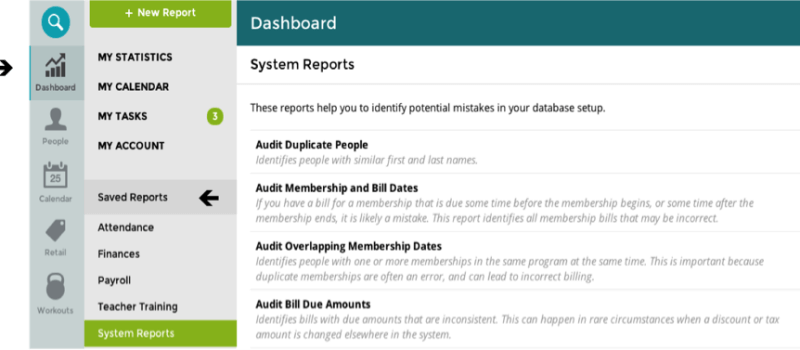 You know your members are most successful when they track their workouts and eating habits. Running a business is no different; you’re going to be more successful if you consistently keep track of how the business is doing. Your Saved Reports house an encyclopedia of information about your business, as every tiny piece of data is saved here. [clearfix]
How do I save reports and then access them in the future?
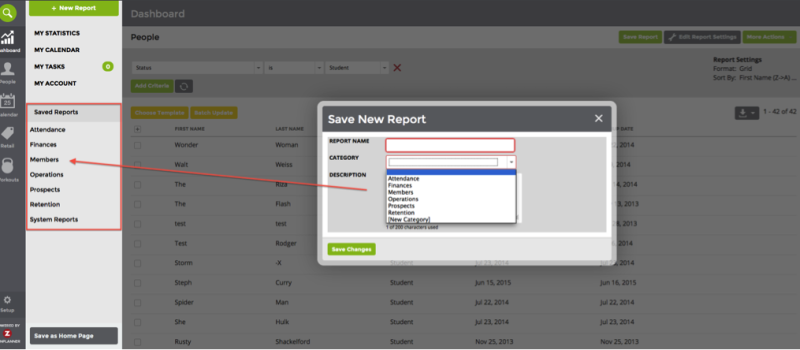
At the top right hand side of your report you’ll see an option in green for “Save Report” next to the “Edit Report Settings” button. Once you click, “Save Report” you’ll see the options to name the report, categorize it and add a description. You’ll notice that the categories correspond to the different label options in the Secondary Navigation Bar of the Dashboard. It’s in each of these Saved Report-categories that you’ll find your old reports.
How do I edit or modify reports?
At the top right hand side of most reports in Zen Planner you’ll see an option to “Edit Report Settings”. If you’re in a Saved Report, you may need to click on the “Edit Report” button first to unlock the criteria in the report.
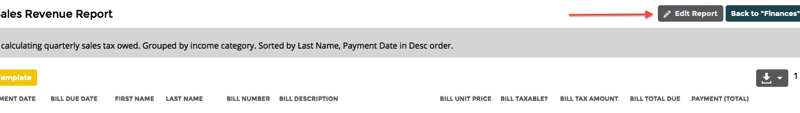
 At that point you’ll unlock the criteria for that report as well as the “Edit Report Settings” button. Once you’ve clicked, “Edit Report Settings” you’ll see a number of ways that you can edit the report.
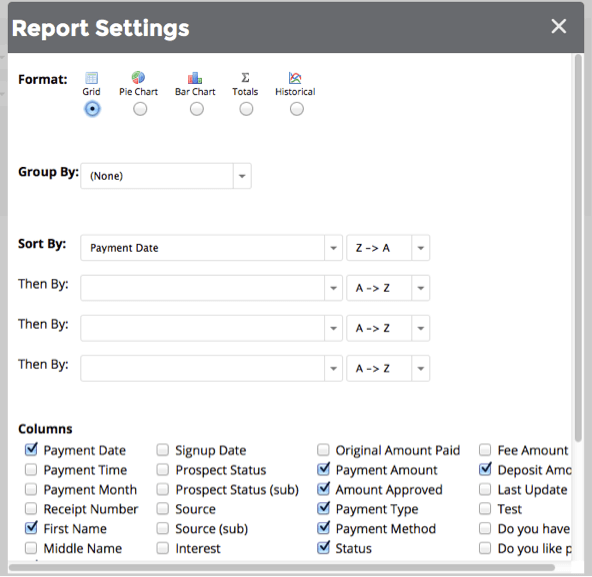
- Format: Change the way in which the data is displayed
- Group By: Gather data sets by a particular category
- Sort By: Edit the order in which the data is displayed in your report (you can also do so by clicking on column titles once you’re in a report)
- Columns: What information is included in your grid-formatted reports [cleanfix]
What are some your favorite reports Zen Planner?
There are a lot of really great resources in the Saved Reports section of your Dashboard. It’s like picking your favorite Ninja Turtle; there’s one that really stands out. For us, that report is one that is particularly useful for budgeting and furcating. Under the Finances section you’ll find the “Average Client Value Report”.
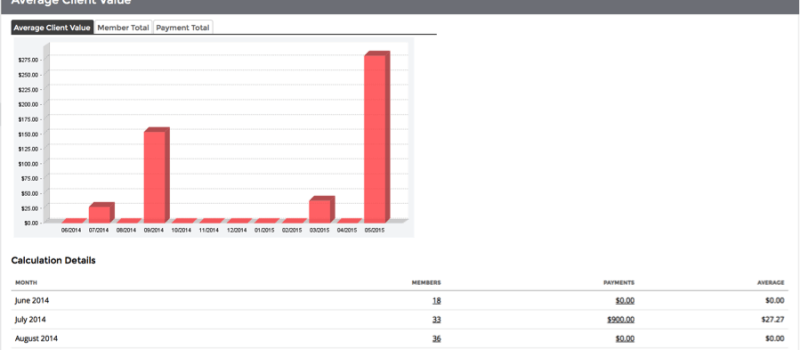
This report will essentially take the total number of payments and divide it by the number of members during a calendar month. The report will not only show you a helpful bar chart on the trends of your average client value but also the trends in member total and payment total.We also hear our customers talk about their favorite reports on a consistent basis. Will from Push!FITstudio in Ontario states, “The Attendance report in Zen Planner gets a ton of use around our studio, especially as we track our consultation appointments for potential new clients. This report allows me to pull up last month’s consultations for a quick and easy overview of how many appointments were booked in total. Very easy and very helpful!”
Do you have a favorite report in Zen Planner? Or have any of the reports our solution offers changed the way you track success at your fitness business? Share your stories in the comments section below!
If you’re looking for additional tips to help you use Zen Planner to its full-potential, check out our Zen Hacks eBook. It’s chock-full of tips from reporting and tasks to scheduling shortcuts. Download it for free today!


I’m Coach Kelli, a devoted CrossFit gym owner with 15 years of experience managing my facility, along with owning yoga studios and wellness centers. Beyond the fitness world, I have a passion for cooking, cherish moments with my children and family, and find joy in spending time outside. Having experienced the highs and lows, I’m dedicated to leveraging my expertise to help you grow and succeed on your fitness journey.
About the Author: Kelli Sweeting


I’m Coach Kelli, a devoted CrossFit gym owner with 15 years of experience managing my facility, along with owning yoga studios and wellness centers. Beyond the fitness world, I have a passion for cooking, cherish moments with my children and family, and find joy in spending time outside. Having experienced the highs and lows, I’m dedicated to leveraging my expertise to help you grow and succeed on your fitness journey.